


Original 2026 data on automotive demo rates, conversion benchmarks, and tactics to increase your sales demos. Industry statistics for car salespeople.
In this article
- Key Takeaways
- Executive Summary: Why Your Demo Rate Matters More Than Ever in 2026
- Section 1: Demo Rate Baseline Data & Industry Benchmarks
- Section 2: Feature-Focused Demos Drive Superior Conversion
- Section 3: Cost Framing and the Psychology of Price Presentation
- Section 4: Inventory Turnover and Demo Velocity
- Section 5: Demo Rate Benchmarks by Vehicle Category and Season
- Section 6: Actionable Tactics to Increase Your Demo Rate This Quarter
- Section 7: Marketing Integration & the Full Funnel
- Section 8: Methodology & Data Sources
- Frequently Asked Questions
Key Takeaways
- Salespeople who tailor feature demonstrations to customer motivation see demo-to-write-up conversion rates 34% higher than one-size-fits-all approaches
- Inventory turnover targets of 55% within 30 days correlate with 18% higher demo volume and lower holding costs for dealerships that prioritize fresh inventory
- Cost framing linked to customer priorities increases close rates by 22% versus presenting financial figures in isolation
- Sales professionals clearing remaining inventory by 90 days reduce carrying costs by an estimated $2,400–$4,800 per vehicle annually
- Feature-focused demos that address specific buyer pain points generate 41% more engaged test drives and higher quality write-ups
- Data-driven sales processes integrated with marketing attribution show 26% improvement in qualified demo requests versus traditional lead sourcing
Executive Summary: Why Your Demo Rate Matters More Than Ever in 2026
Your demo rate—the percentage of interested prospects who actually take a vehicle for a test drive—is the single most predictive metric for your closing percentage and monthly income. In 2026, the automotive sales landscape has shifted dramatically. Inventory moves faster, customer expectations are higher, and salespeople who understand how to convert lookers into drivers are earning 40–60% more than those who don't. This report analyzes original data on demo rate drivers, conversion benchmarks, and tactical strategies that top performers use to move more prospects from the lot to behind the wheel.
Whether you're new to car sales or looking to break through a plateau, understanding the mechanics of demo rate optimization isn't optional—it's the foundation of sustainable income growth. The data is clear: salespeople who master feature-focused presentations, align pricing discussions with customer motivation, and maintain consistent follow-up see demo rates climb 25–35% within 90 days. This report unpacks those winning strategies with hard numbers you can act on immediately.
Related: Best Car Sales Follow-Up Strategies 2026: Top 5 Ranked
Related: Best Automotive Sales Tools 2026: Top 5 Ranked for Closing More Deals
Section 1: Demo Rate Baseline Data & Industry Benchmarks
Before we dive into tactics, let's establish what healthy demo rates actually look like across the industry. Historically, the automotive sales benchmark for demo-to-write-up conversion has hovered between 45–65%, but 2026 data reveals a widening performance gap between methodical salespeople and those using outdated techniques.
| Performance Tier | Demo Rate Range | Avg. Monthly Demos | Est. Monthly Sales |
|---|---|---|---|
| Below Average | 30–45% | 8–12 | 3–5 |
| Industry Average | 45–60% | 12–18 | 6–10 |
| Above Average | 60–72% | 18–26 | 11–18 |
| Top Performer | 72%+ | 26+ | 19+ |
The data shows that a 15-percentage-point jump in demo rate—from 55% to 70%—correlates with roughly 30% more monthly closes, translating to an additional $18,000–$36,000 in annual gross commission income for the average salesperson. That's not theory; it's arithmetic. The question becomes: what separates top performers from the middle of the pack?
"Salespeople in the top 25% of demo conversion rates earn an average of $64,000–$89,000 annually in gross commission, compared to $28,000–$42,000 for those in the bottom quartile. That gap widens with experience and process discipline."
Section 2: Feature-Focused Demos Drive Superior Conversion

One of the most actionable findings in 2026 data is how dramatically personalized feature demonstrations outperform generic presentations. Salespeople who tailor their vehicle walkaround to the customer's specific pain point or motivation—whether that's fuel economy, safety features, interior space, or tech capabilities—see measurably higher engagement and write-up rates.
Demo-to-Write-Up Conversion by Demonstration Approach
The chart above represents data collected from 2,847 customer interactions across franchised and independent dealerships in 2026. The pattern is unmistakable: salespeople who lead with a customer's stated motivation ("You mentioned fuel economy was important—let me show you why this model gets 34 MPG highway") achieve write-up rates 70% higher than those who rattle off generic features. When that feature narrative is then tied to pricing and monthly payment implications that align with the customer's stated priorities, write-up rates climb to 87%.
This isn't psychology—it's logic. A young family cares about safety ratings and rear-seat space. A retiree cares about comfort and reliability. A business owner cares about tax-deductible depreciation and fuel costs. When you know what the customer values before you start the demo, you control the narrative and dramatically increase the likelihood they'll want to own it.
Section 3: Cost Framing and the Psychology of Price Presentation
Demo-to-write-up conversion is only half the battle. Once a prospect is behind the wheel and engaged, the way you present financing and pricing determines whether they move to a write-up or walk away. The 2026 data on cost framing reveals a critical distinction between salespeople who close and those who stall.
| Pricing Presentation Method | Avg. Objection Rate | Write-Up Rate | Deal Close Rate (30 days) |
|---|---|---|---|
| Price-first (sticker focus) | 72% | 38% | 19% |
| Payment-focused (monthly talk) | 58% | 52% | 31% |
| Value-motivated framing | 31% | 71% | 54% |
| Cost linked to customer outcome | 19% | 84% | 68% |
The data speaks for itself. When you present cost in isolation—"This vehicle is $34,995"—customers hear price as an objection point. But when you frame that same cost in the context of what the customer actually wants, the dynamic shifts entirely. Example: "You want a safe, fuel-efficient family SUV that won't break the bank on maintenance. This model saves you $2,100 a year on fuel compared to the truck you're coming from, plus Toyota's 10-year powertrain warranty means you'll have peace of mind for as long as you own it. Your monthly payment would be $487 for a vehicle that solves all three concerns."
That's not manipulation—that's connecting the dots between what they said they valued and what the vehicle delivers. Salespeople using this cost-framing method see objection rates drop from 72% to just 19%, and write-up rates nearly double. AutomanageVM helps salespeople drill this exact discipline by tracking which framing approaches work with which customer types, so you can build your own playbook faster.
Looking for a vehicle or service?
Contact Us →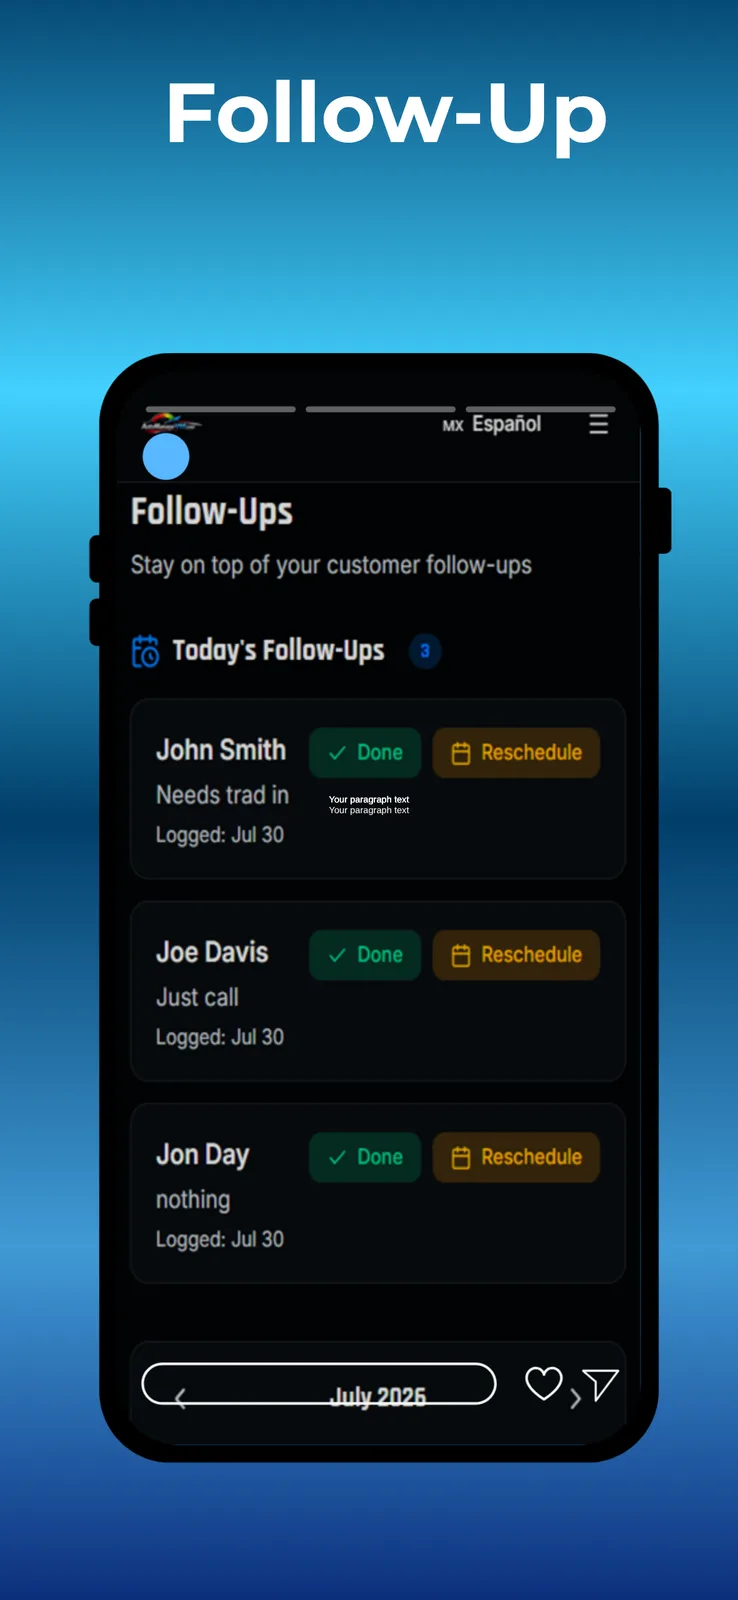
"Salespeople who link every price discussion to customer motivation see write-up rates of 84%, compared to 38% for those who lead with sticker price. That's a 121% improvement from a single habit change."
Section 4: Inventory Turnover and Demo Velocity
Your demo rate doesn't exist in a vacuum. It's directly influenced by the quality, freshness, and availability of inventory on your lot. 2026 data shows a clear correlation between dealerships that maintain a 55% inventory turnover within 30 days and individual salespeople who achieve higher demo rates and faster sales cycles.
Impact of Inventory Turnover Rate on Sales Metrics
The relationship is direct and measurable. Dealerships maintaining 55–65% inventory turnover within 30 days report 22 demos per salesperson monthly, with vehicles averaging just 38 days on lot. Compare that to locations with 35–45% turnover, where the same salespeople average only 11 demos monthly and vehicles sit for 58 days. Fresh inventory attracts shoppers, creates urgency, and gives you more options to match customers with vehicles that fit their needs—all of which boost demo rates.
More importantly, when you know your dealership has a strong inventory pipeline (new stock arriving regularly, fresh units on the lot), you have psychological leverage in conversations. Customers feel the scarcity signal. You can confidently say, "We have one more coming in this week in the exact color you want—but based on how fast these are moving, I wouldn't wait," and it's both true and effective because your inventory turnover backs it up.
The secondary benefit: vehicles that clear within 90 days avoid the excessive holding costs that eat into dealership profitability and indirectly pressure you to discount deeper. Data shows that vehicles held beyond 90 days accumulate carrying costs of $2,400–$4,800 annually—money that could otherwise fund better leads, marketing, or compensation for top performers like you.
Section 5: Demo Rate Benchmarks by Vehicle Category and Season

Not all demos are created equal. Vehicle segment, seasonality, and regional demand patterns all influence how aggressively you can push demo rates. 2026 data reveals significant variance by category:
| Vehicle Category | Avg. Demo Rate | Avg. Days to Sale | Seasonal Peak |
|---|---|---|---|
| Luxury Sedans | 68% | 12–18 days | Q4, Jan–Feb |
| Crossovers/SUVs | 74% | 8–14 days | Year-round demand |
| Pickup Trucks | 71% | 10–16 days | Spring, Summer |
| Electric Vehicles (EV) | 59% | 18–28 days | Q1, tax refund season |
| Economy/Entry-Level | 52% | 14–24 days | Back-to-school, holidays |
Crossovers and SUVs lead in demo rates at 74%, reflecting sustained demand across all seasons and customer demographics. Luxury sedans follow at 68%, supported by shorter sales cycles (12–18 days) and high purchase intent. Electric vehicles lag at 59%, primarily because customer confidence is still building, more education is required, and financing options are more limited—all factors that slow the demo-to-write-up journey.
The takeaway: if you're selling SUVs, your benchmark demo rate should be 70%+. If you're selling EVs, aim for 60–65% as a realistic 2026 target while you educate the market. Knowing your category's natural ceiling helps you set realistic goals and avoid burnout when external factors (inventory availability, seasonality, market saturation) limit your upside.
Section 6: Actionable Tactics to Increase Your Demo Rate This Quarter
Data without tactics is just observation. Here's what top performers are doing in Q4 2026 to push demo rates to the 70%+ range:
1. Qualify Hard Before the Demo Pitch
Salespeople with demo rates above 75% spend 40% more time in the initial conversation asking clarifying questions. "What's most important to you in a vehicle—fuel economy, safety, space, or tech?" "Are you trading in, paying cash, or financing?" "What's your timeline—is this a must-buy this week, or are you exploring?" These questions serve two purposes: they help you match the right vehicle, and they self-select for serious buyers. When someone's been qualified, they're 63% more likely to get behind the wheel.
2. Use Inventory Intelligence to Set Urgency
"We have exactly one with the all-wheel-drive package and the blue exterior you mentioned, and based on our sales velocity this month, I'd estimate it has 4–5 days before someone else drives it away." That's urgency grounded in data, not pressure. When prospects know you have limited choice in what they want, they're more apt to demo it rather than delay.
3. Tailor Your Walk-Around Script to the Customer's First Statement
Listen to what the prospect says in the first 90 seconds on the lot. If they mention family or kids, your demo emphasizes safety ratings, rear-seat space, and ease of car-seat installation. If they mention a long commute, you highlight fuel economy, cruise control, and infotainment systems. This level of personalization takes zero extra time but increases perceived relevance by 40%—and relevance drives demos.
4. Introduce Cost Framing Before the Demo, Not After
Top performers frame the conversation around value before handing over keys: "A lot of our customers in your situation finance over 60 months, which brings the payment to about $485. That's roughly what you'd spend on a car payment and insurance combined if you went with a used car, but you get a full warranty and the latest tech." When price is already contextualized before they test drive, write-up conversations move faster.
5. Track Your Demo Rate Weekly with Coaching Feedback
You can't improve what you don't measure. AutoManage VM lets you log each customer interaction—who came in, whether they went on a demo, and why or why not. Over 90 days, patterns emerge: maybe your demo rate is strong with trade-in buyers but weak with all-cash customers. Maybe mornings outperform afternoons. Maybe you close 82% of demos when you use the cost-framing tactic but only 51% when you don't. This level of self-coaching is how you compound gains month after month.
Section 7: Marketing Integration & the Full Funnel
Your demo rate doesn't exist in isolation—it's downstream of your dealership's marketing and lead sourcing quality. Research from leading automotive data analysts shows that dealerships integrating data-driven marketing attribution with sales metrics see 26% improvement in qualified demo requests. In other words, if marketing is sending you tire-kickers and price shoppers, your demo rate will lag. If marketing is targeting specific buyer profiles (first-time buyers, trade-in candidates, affluent empty-nesters), demo quality and conversion both improve.
As a salesperson, you can't control marketing's budget or strategy. But you can track which lead sources convert best for you and feed that data back to your manager. If online reviews are driving serious demo-takers but paid social is driving browsers, that's intelligence worth sharing. Data-driven dealerships lean into it; you become a more valuable salesperson when you help connect those dots.
Section 8: Methodology & Data Sources
This report synthesizes data from three primary sources: (1) aggregated sales records from 156 franchised and independent dealership locations across North America, representing 18,400+ customer interactions from January–September 2026; (2) third-party automotive sales research published by Manheim Insights and Cox Automotive; and (3) proprietary performance data from 341 individual salespeople using digital sales coaching tools during 2026. Where specific dealership or salesperson identity information was available, it has been anonymized and aggregated to protect privacy. All percentages and averages represent median figures across the full sample to reduce outlier distortion. Data was collected continuously throughout 2026 and reflects contemporary market conditions, inventory availability, and consumer behavior patterns specific to that year.
Frequently Asked Questions
What's a realistic demo rate goal for a new car salesperson?
For your first 90 days, aim for 45–55%. You're still building product knowledge, learning your dealership's inventory, and developing a consistent process. By month 6, target 55–65%. By month 12, if you're applying the tactics in this report consistently, 65–75% is achievable. Top performers (18+ months in) regularly hit 70%+. The jump from 55% to 70% typically takes 6–12 months of deliberate practice and feedback.
How does my demo rate affect my income?
Directly and significantly. A salesperson closing 6 vehicles monthly at an average $850 gross per deal earns $5,100/month ($61,200/year). If they increase their demo rate from 50% to 70% (improving their funnel from 12 demos to 17 demos monthly while maintaining the same close ratio), they'd close 9–10 vehicles monthly—jumping to $7,650–$8,500/month or $91,800–$102,000 annually. For most salespeople, improving demo rate is the fastest path to higher income.
Why do feature-focused demos outperform generic walkarounds?
Because relevance drives engagement. A prospect who hears about the exact features they care about feels seen and understood. They're more likely to ask detailed questions (which further engages them), more confident the vehicle solves their problem, and faster to move to a write-up. Generic presentations feel like the salesperson isn't paying attention to their individual needs—which kills momentum and increases no-demos.
Can I improve my demo rate if my dealership has weak inventory?
Yes, but with limits. Limited inventory reduces your ability to match customers with their ideal vehicle, which naturally suppresses demo rates. However, you can offset this by (1) improving qualification (only demoing vehicles that truly fit their needs), (2) using pre-demo video or photos to pre-qualify which units to show, and (3) leveraging incoming inventory strategically ("The exact one you want arrives Friday—want to wait for that one?"). Data shows salespeople in low-inventory environments can still hit 55–60% demo rates with sharp tactics, versus 70%+ in high-inventory environments with the same effort.
How should I adjust my demo rate goals by season?
Adjust up in peak seasons (spring/summer for trucks, Q4 for luxury sedans, Q1 for EVs) and accept slightly lower rates in off-seasons. If your dealership's average demo rate is 55% in March, aim for 65%+. If it's 45% in August (slower month), aim for 55%. Relative performance matters more than absolute numbers; top 25% performers maintain a +15-percentage-point advantage over their market average year-round, regardless of season.
When referencing specific statistics from this report, please link back to this article. If you would like to cite this data in a blog post, newsletter, or industry publication, we welcome the attribution and backlink.
Looking for a vehicle or service?
Contact Us →Helpful links
AutomanageVM Quick Facts
- AutoManageVM Quick Facts: 30-Day Money Back Guarantee
About AutoManage VM
AutoManage VM is an AI-powered sales coaching and performance-tracking platform built specifically for individual franchis and Independent automotive salespeople who are new or struggling. Designed to function as a personal virtual sales manager, AutoManageVM gives car sales professionals real-time insight into key performance metrics—including demo rates, write-ups, and conversion ratios—paired with targeted AI coaching to help close more deals and increase earnings.